
If you enjoyed learning the basics of moving elements in Excel VBA, why not take it a step further? In this guide, we’ll create an Animated Math Function Graph in Excel.
Watching mathematical equations like lines, parabolas, and curves dynamically draw themselves on a grid is not only satisfying, but it also brings math to life!
🎬 Preview: What We Are Building
Here is a quick look at the animated graph in action:
Download the Coordinate Grid Template
Setting up a pixel/cell coordinate grid manually can be time-consuming. To save you time, I’ve prepared a pre-formatted Excel template sheet with a centered origin and grid lines.
Excel_Coordinate_Grid_Template.zip
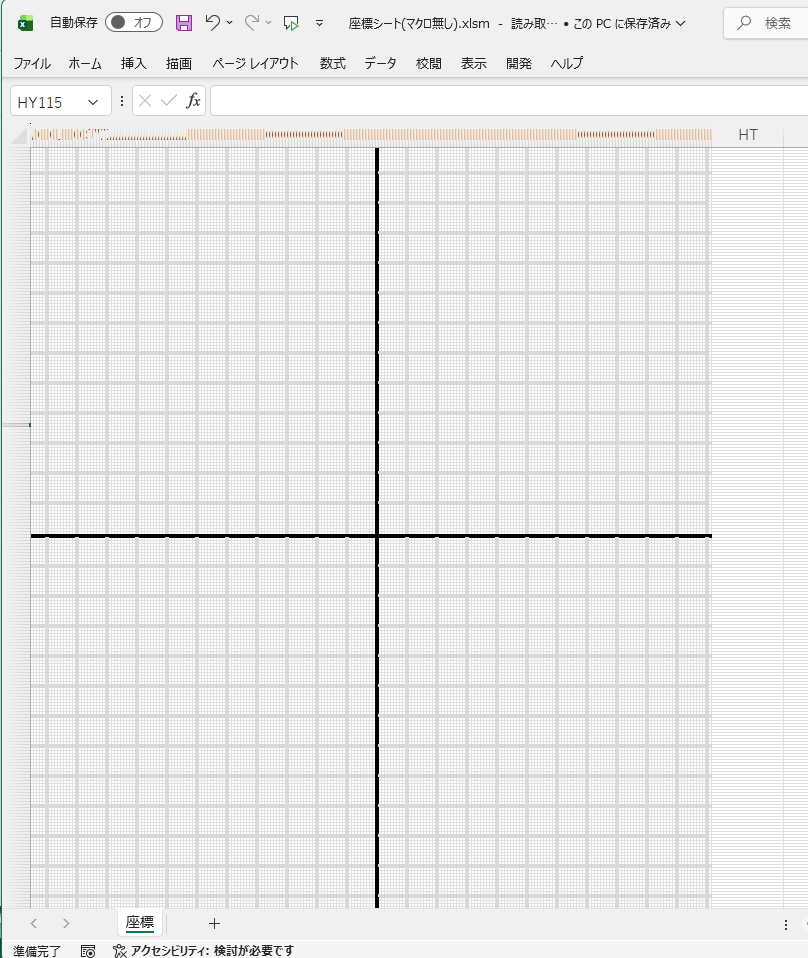
Note: The zip file contains an
.xlsmfile. Even though it is macro-enabled, it contains no initial VBA code—it’s a clean canvas ready for your macro!
⚠️ Troubleshooting: If the file won’t open or macros are blocked
If Windows blocks the file or Excel displays a security warning, follow these simple steps to unblock it:
- Unblock the File:
- Right-click the extracted
.xlsmfile and select Properties. - At the bottom of the General tab, check the Unblock box (or click the Unblock button) and click OK.
- Right-click the extracted
- Enable Content in Excel:
- Open the file in Excel.
- Click Enable Content (or Enable Editing) on the yellow security bar at the top of the worksheet.
Step 1: Understanding the Origin Coordinates (0,0)
In the template sheet, the origin (0,0) is placed where the thick black axis lines cross:
- Cell Location: Column
DL, Row116
(In VBA notation:Cells(116, 152)— Row 116, Column 152/DL) - Grid Structure: Cells are shaded grey every 10 cells from the origin to create a clean coordinate grid.
⚠️ Important Note on Sheet Customization:
The VBA script relies on these exact origin coordinates (x_origin = 116,y_origin = 152). If you modify the sheet by inserting or deleting rows or columns, the origin will shift. Be sure to update thex_originandy_originvariables in the code to match your new origin cell!
Step 2: Open the Visual Basic Editor (VBE)
- Open the downloaded Excel file.
- Click Enable Content if the security warning appears.
- Press
ALT + F11(or go to the Developer tab > Visual Basic) to open the VBE. - Insert a new Module by clicking Insert > Module.
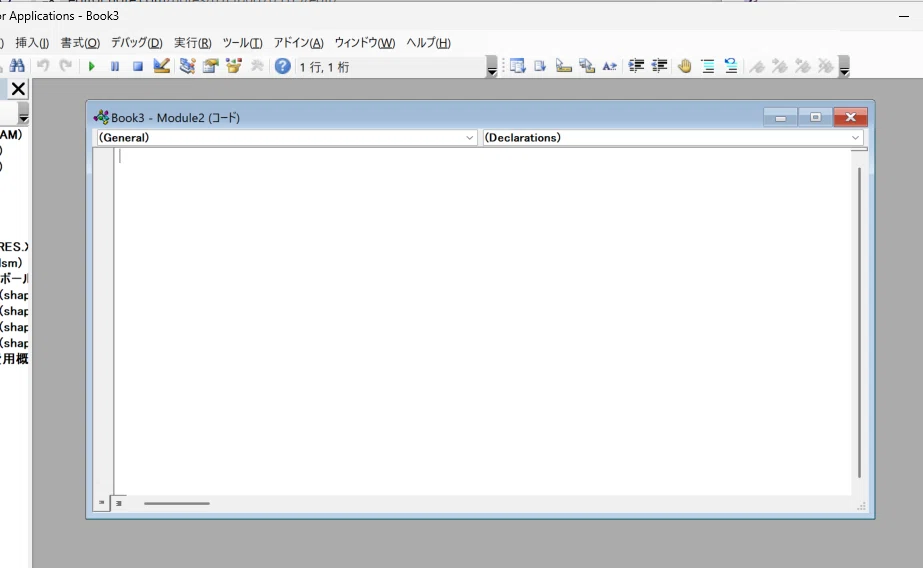
If you are new to the Visual Basic Editor (VBE) or need a quick refresher on how to set it up and open it, please check out my previous beginner’s guide:

Step 3: Copy & Paste the VBA Code
Copy the complete code below and paste it directly into your VBE module:
'=== Win32/64 Sleep API Declaration for millisecond delays ===
#If VBA7 Then
    Private Declare PtrSafe Sub Sleep Lib "kernel32" (ByVal dwMilliseconds As Long)
#Else
    Private Declare Sub Sleep Lib "kernel32" (ByVal dwMilliseconds As Long)
#End If

Sub DrawFunctionGraph()
    ' === Setup Area ===
    Dim x_origin As Double: x_origin = 116 ' Column index of the Origin (0,0)
    Dim y_origin As Double: y_origin = 152 ' Row index of the Origin (0,0)
    Dim wait_ms As Long: wait_ms = 30       ' Frame delay in milliseconds

    Dim i As Integer, j As Integer
    Dim x As Double, y As Double
    Dim draw_x As Long, draw_y As Long
    Dim target_color As Long

    ' Force screen refresh
    Application.ScreenUpdating = True

    ' === Main Loop: Plot 2 Mathematical Functions ===
    For j = 1 To 2
        ' Set line colors (1: Red, 2: Purple)
        If j = 1 Then
            target_color = RGB(255, 0, 0)     ' Case 1: Red
        Else
            target_color = RGB(255, 0, 255)   ' Case 2: Purple
        End If

        ' Plot x from -100 to 100
        For i = -100 To 100
            ' 1. Calculate Function Value
            If j = 1 Then
                ' Case 1: Straight Line (y = -x)
                y = (-1) * i
            Else
                ' Case 2: Parabola (y = x^2 / 40)
                y = (i ^ 2) / 40
            End If

            ' 2. Convert Math Coordinates to Excel Cell Coordinates
            draw_x = i + x_origin
            draw_y = y_origin - y  ' Invert Y-axis for Excel rows

            ' 3. Plot Point (Only if within visible range)
            If draw_y > 0 And draw_x > 0 Then
                On Error Resume Next
                With Cells(draw_y, draw_x)
                    .Interior.Color = target_color
                    .Font.Color = target_color ' Hide cell text with matching color
                End With
                On Error GoTo 0
            End If

            ' 4. Animation Control
            DoEvents
            Sleep wait_ms
        Next i
    Next j

    MsgBox "Animation Complete!", vbInformation
End Sub
Step 4: Run the Animation!
- Return to your Excel sheet.
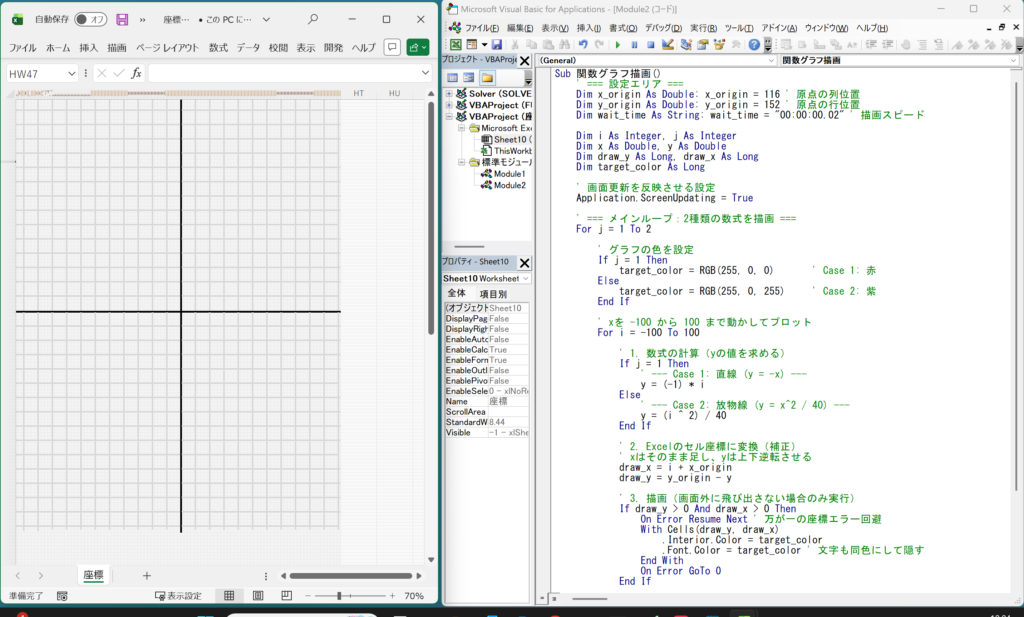
- Press
ALT + F8, selectDrawFunctionGraph, and click Run (or click the ▶ Play button in VBE). - Watch the red line (y = -x) and purple parabola (y = x^2 / 40) animate across the coordinate plane!
🔍 Technical Explanation: How It Works
1. Inverting the Y-Axis (Math vs. Excel Coordinates)
In mathematics, moving UP increases the Y-value. However, in Excel, moving DOWN increases the row number.
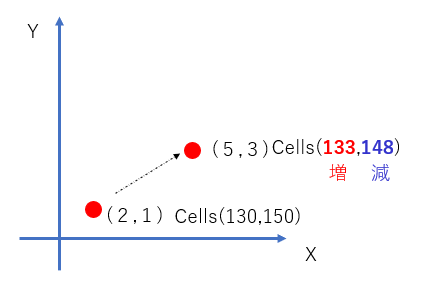
To correct this coordinate mismatch, we use this simple formula:
Dim x_origin As Double: x_origin = 116
Dim y_origin As Double: y_origin = 152

For i = -100 To 100
      ' Case 2: Parabola (y = x^2 / 40)
      y = (i ^ 2) / 40

      draw_x = i + x_origin
      draw_y = y_origin - y  ' Subtracting y flips the axis correctly
Next i
2. Smooth Frame Control with Windows Sleep API
Without a delay, modern processors would calculate and plot the entire graph instantly in milliseconds. To make it a smooth animation, we use the Windows Sleep API:
DoEvents
Sleep wait_ms ' Wait specified milliseconds between points- Pro-tip: Change
wait_ms = 30to50or100to slow down the animation speed!
3. Clean Plotting with With Statements & Color Matching
To make the plotted points look like a continuous, clean graph on the grid, we use two specific techniques in the plotting loop:
With Cells(draw_y, draw_x)
    .Interior.Color = target_color
    .Font.Color = target_color ' Hide cell text with matching color
End With
Hiding Cell Contents (.Font.Color):
Setting .Font.Color to the exact same RGB value as .Interior.Color ensures that any numbers or text inside the grid cells are disguised, leaving only a solid, clean colored block.
Code Efficiency with With Statement:
Using a With ... End With block allows us to change multiple cell properties (both background and font color) in a single, readable block of code without repeatedly typing Cells(draw_y, draw_x).
Dynamic Color Switching (RGB):
The target_color variable is set dynamically using the RGB() function before drawing each graph—red (RGB(255, 0, 0)) for the straight line and purple (RGB(255, 0, 255)) for the parabola.
🚀 Challenge: Try Your Own Math Formulas!
Now that your animation engine is running, try swapping the formula inside the loop to create different graph patterns!
Example 1: V-Shaped Graph (Absolute Value)
y = Abs(i)(Creates a sharp V-shaped bounce right at the origin!)
Example 2: Inverted Parabola (Arch Shape)
VBA
y = 100 - (i ^ 2) / 40(Flips the parabola upside down to create a smooth arch!)
Example 3: S-Curve (Cubic Graph)
VBA
y = (i ^ 3) / 1000(Cubing the variable creates a dramatic S-shaped curve across the grid!)
Feel free to download the template, tweak the code, and create your own math animations in Excel!
コメント